
Data visualisation system

DViz

Dec 2024 – Jan 2025

Fast, flexible, tokenised charts: a library that turns data into dynamic visual stories.
TokenizedScalableCustomizableDashboardsDocumentation
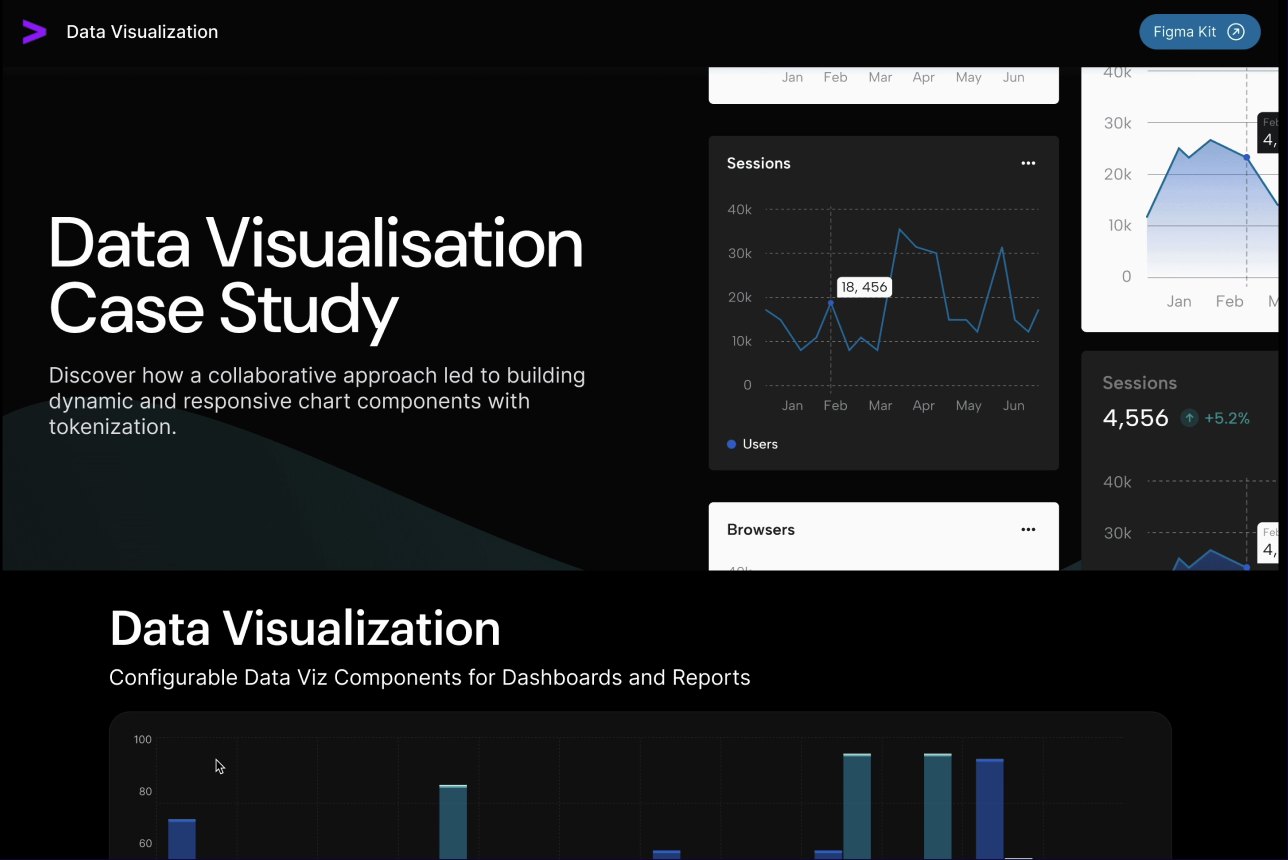
DViz documentation and chart components
My role

Product Designer

Timeline

Dec 2024 – Jan 2025

Users

Dashboard designers and developers

Tools

Figma, Zeroheight

01Impact

12+chart and visualization types
2theme modes: light and dark
1team knowledge-sharing session

02Context

The problem

Every dashboard was reinventing its charts. The team needed one customizable, responsive library that stayed consistent across reports and themes.
[Add: one line on the business goal or how success was measured]
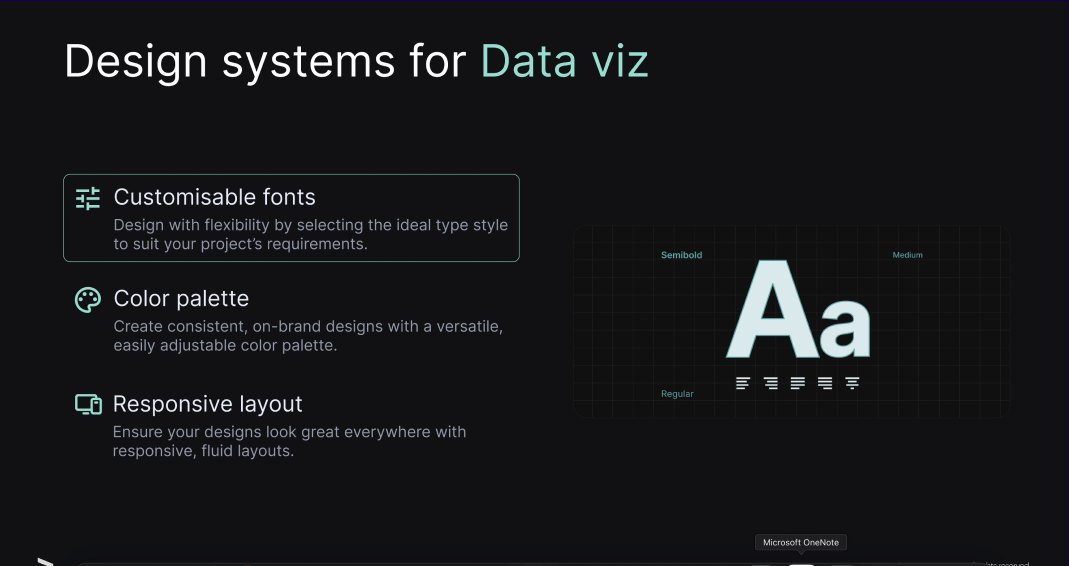
Design system for data visualisation: fonts, colour palette, responsive layout

03My contribution

What I did

04Use cases and decisions

How I decided

01

Tokens first

Palette, type and theme modes are tokens, so a chart can change look without changing structure.

02

Document it like a product

Light and dark documentation covers every feature, colour and component, so adoption does not depend on me.

03

Teach while building

Mentoring interns and presenting to the team turned the library into shared knowledge.

[Add: name the options you rejected for one decision]

05Process and solution

Screens and flows

DViz documentation
DViz system
Image placeholder: chart components

06Outcome

Results and learnings

A tokenised chart library with 12+ chart types, documented in light and dark, and a clear path to evolve the wider design system.

[Add: one thing you would do differently, and one thing you learned]

“Add a testimonial that fits this project.”

Name · Role